The past couple of months I have been writing code in Google Earth Engine (GEE). For those that don’t know what GEE is – in brief is a database of satellite imagery and a code window to create a run scripts. Data can be uploaded to the GEE platform, and exported (downloaded). The database of satellite imagery includes recent (today) and historical data (as far back as 1972) depending to the type of satellite. Landsat data is continuous from 1972 – current, Sentinel 1 (2014- current), Sentinel-2 (2016-current), and other satellites have shorter time periods (2000-current). In essence, the availability of historical data provides a means to “move back” in time, where as the current and yet-to be collected data provides a means to move forward in time.
Air temperature Trend (2000-2020)
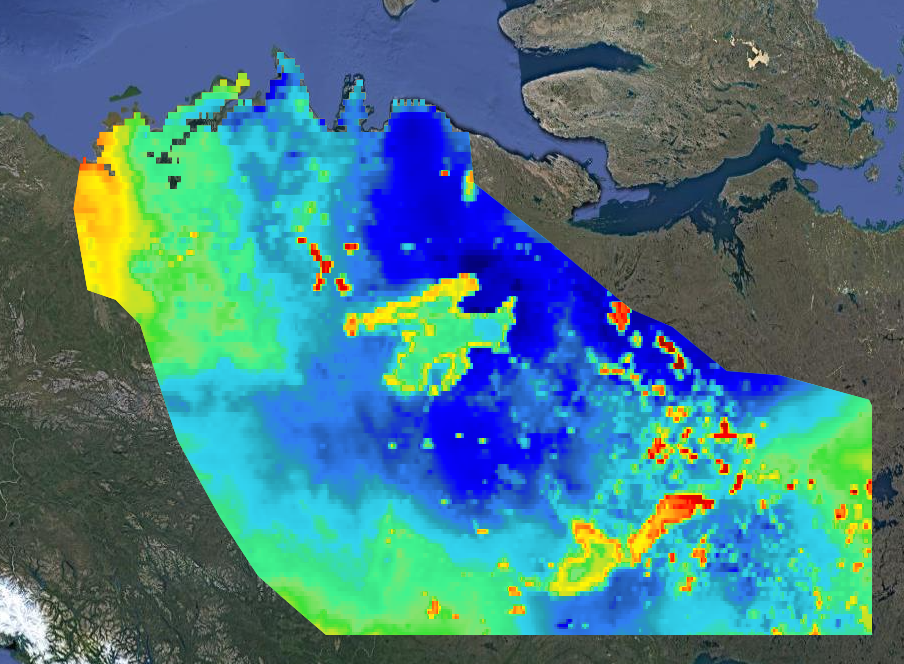
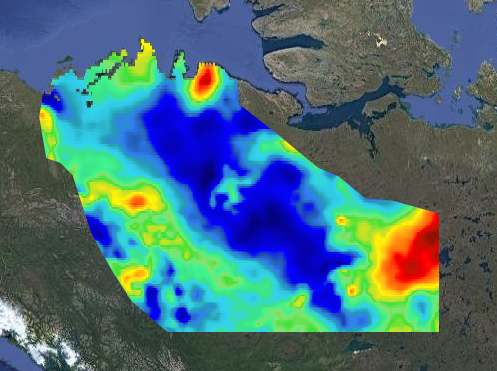
In this post I will demonstrate a couple of GEE Mapping Tools that I created in GEE to illustrate 20 year Trends (2000-2020) in Air Temperature, Snowfall/snow depth/density/temperature, and Lake ice-temperatures across the NWT.
NWT Snowfall Trend (2000-2020)
Click on the links below to view the Mapping Tool
NWT Climate Trends Mapping Tool