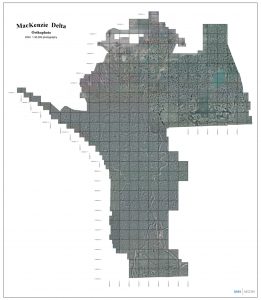
Measuring of Coastal Erosion at Baillie Islands (Cape Bathurst)


Location
Baillie Island is located at the northern tip of Cape Bathurst, the most northern portion of mainland NWT.

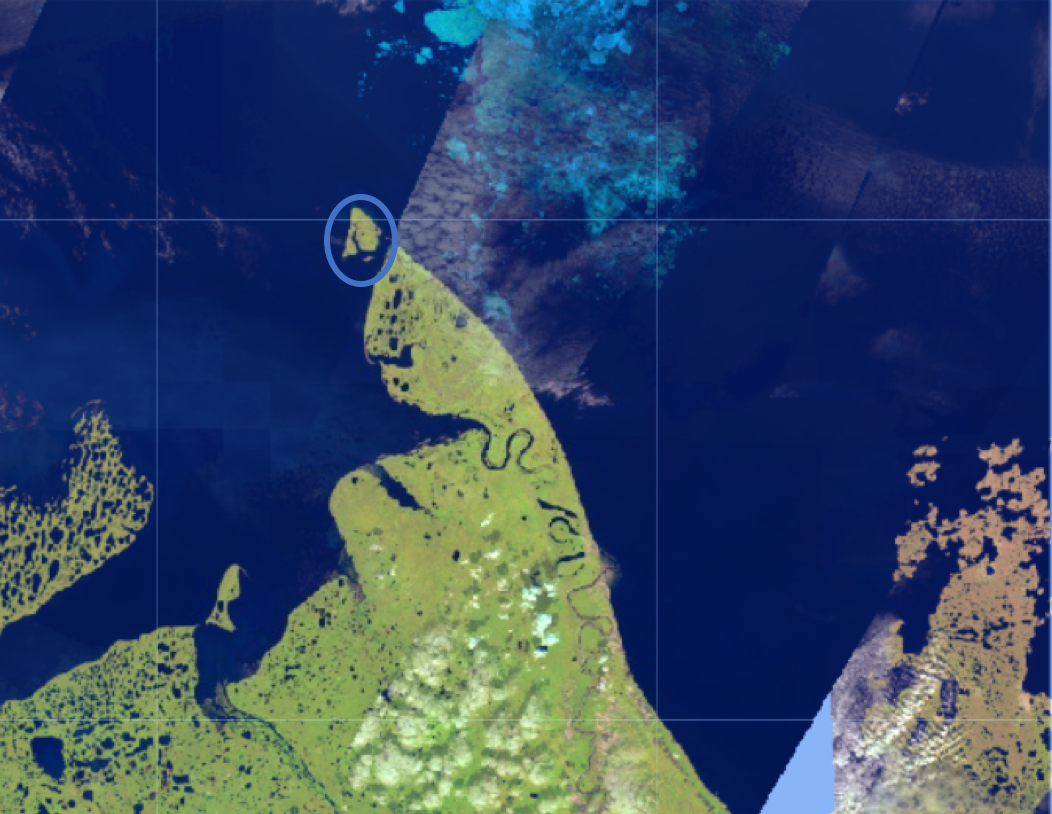
This area is of importance due to the occurrence the rare hairy rockcress or hairy braya (Braya pilosa, genus Braya of family Brassicaceae) that is observed at five locations on the Baillie Islands and Cape Bathurst.
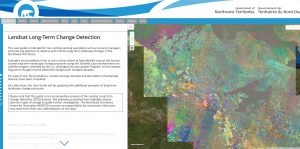
Methodology
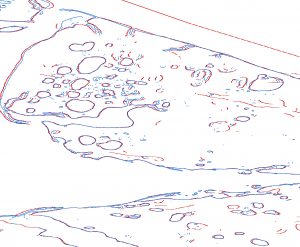
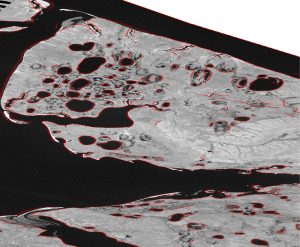
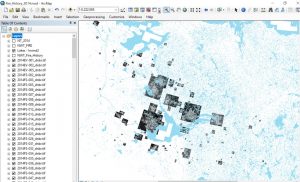
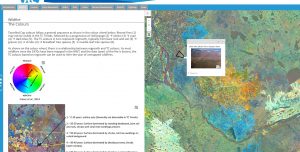
Two different methods were used to measure coastal erosion on Braille Islands. Both methods use an early and later (most recent satellite image). The measure distance between the coastline of earlier and coastline of the later satellite image is inferred to be the amount of coastal erosion between the date of the earlier image and the date of the later image. The difference between Method-1, and Method-2 is the time span between the earlier and later image, and the resolution of the satellite imagery. Method-1 uses the earliest available moderate resolution (30m) Landsat satellite imagery 1985-2021, where as Method-2 users the higher resolution Sentinel-2 (20m) using available dates (2017-2021). Five (A-G) cross sections were used for measuring the distance between the earlier and later satellite image. This was done in ArcGIS Pro. The process of measuring involves subjective interpretation in respect to measuring a smooth surface (thick blue line) of a raster (pixelated) image (see image below).

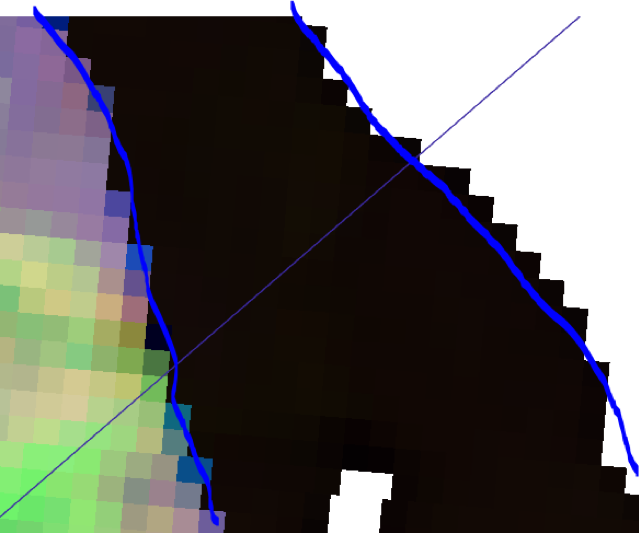
As Sentinel-2 imagery has a finer resolution than Landsat (20m vs 30m) the pixels are smaller, and thus assumed to be closer to the smooth surface representing the actual coastline.

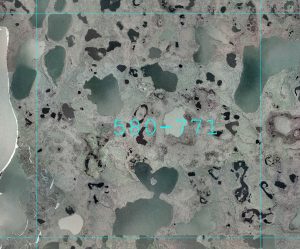
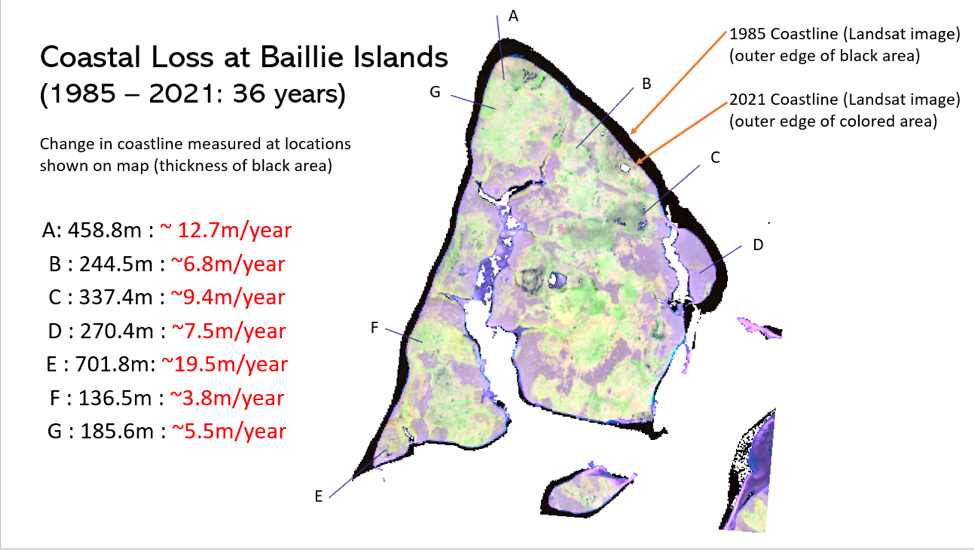
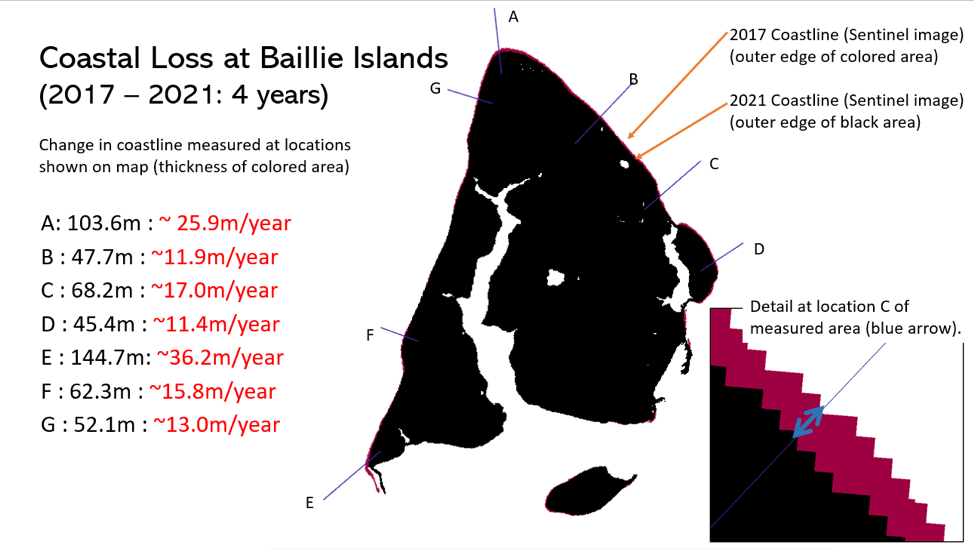
Measured distances between the earlier and later satellite images were divided by the time interval between the earlier and the later images, and shown in red in the following Figures.
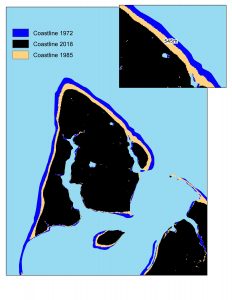
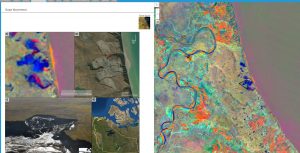
Method-1
This method uses Landsat (1985-2021) imagery for measuring of coastal erosion.
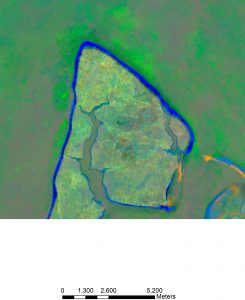
Method-2
This method uses available Sentinel-2 imagery.

Summary
Noting that the date range for Method-1 spans 36 years and 4 years in Method-2, the measured distances at the five cross sections differ significantly. There may be a number of reasons, including the coarser pixel size of the Landsat imagery, and corresponding errors in the subjective interpretation of the measurement between the earlier and later images. There is the possibility that there has been an increase in coastal erosion during the later time interval, thus shewing the averaged erosion rate when divided by the time interval between the earlier and later images.


Time for Something Completely Different

Starting January 10th, 2022 – A New Career.  It is career number …Navy, Geologist, Mineral Development Advisor, Remote Sensing Analyst and and soon – Lands Specialist.

As I write this – Three days to go. It has been a run of 20 years. Bitter sweet to be leaving, especially after the release of the Long Term Change Detection (LTCD) dataset, development of the LTCD User Guide and doing a CBC radio interview. Leaving on a good note, and it is time to move on. The commute will be to the other side of the building, new colleagues, and a completely new job.
Thinking back of the projects I have worked on since 2002. A ton of writing computer code and data processing, creating seamless mosaics of topographic data for all of NWT, forest fire burn severity, identifying and counting caribou and bison using satellite images, flood map predictive models, PM for collection of air photos over proposed Mackenzie Gas project and Mackenzie Delta, mapping coastal erosion at Cape Bathurst (360m in 38 years), and the highlight – the LTCD project for developing scripts to process 40 years of satellite data using Google Earth Engine.
Over the years technology and computer systems evolved from needing high end desktop computer, specialized remote sensing software and having to download satellite data (100’s of Gb per day) to cloud enabled computing – I can run the scripts and process satellite imagery using my phone !. My Thanks to the many colleagues, and my classmates at COGS (2000-2001). 


Mapping Coastal Erosion at Cape Bathurst, NWT.

Mapping coastal erosion – the Old way. Converting the raster (satellite picture into a line layer). 1972 coastline in red, satellite picture (blue outline) from 2010.

Schematic of the changes in the coastline at Cape Bathurst, years and coastline shown.

Coastal erosion shown in blue using the LTCD script. Takes 20 minutes to run – instead of 3 days of eyeball strain !.

Counting wildlife using a satellite image. Satellite is in orbit approx 800km above earth.


Wildfire Burn Severity mapping:

2014 Wildfires in NWT.

Wildfire Burn Severity analysis.

Mackenzie Gas Pipeline Airphoto Project:

Wrote specifications and contract managed for 1;30,000 scale airphotos covering Mackenzie gas Pipeline route (pipeline yet to be built) and Mackenzie Delta,and creating of 1 meter contours and digital elevation model (DEM).

1:30,000 scale airphoto tile.

Area covered by MVAP tiles, contours and DEM (extends down Mackenzie Valley).


Long Term Change Detection (LTCD):

Long Term Change Detection – User Guide.

LTCD User Guide. Description of colours for wildfires.

LTCD User Guide. Sample images of slope movement.


Read more about the User Guide and ESRI ‘App’ of the Month, and CBC Weekender radio interview here:

https://www.geomatics.gov.nt.ca/en/newsroom/long-term-change-detection-wins-esri-canadas-app-month-december-2021